
Blog · Guide · · 2 min read ·
Your Weft sites in your own Grafana
Weft exports every site's health, link latency and loss, traffic and alerts in the format Prometheus reads. One read-only secret, one scrape job, and the numbers sit beside everything else you watch. Tested with a real Prometheus and Grafana.
If you look after networks for several customers, one more console to check is one console too many. You already have somewhere you watch things from, and for a lot of teams that is Grafana.
So Weft now exports each organisation's numbers in the format Prometheus reads. Point a scrape job at it and Weft's sites sit on the same dashboard as everything else. This guide sets that up with a real Prometheus and Grafana, scraping one of our test networks.
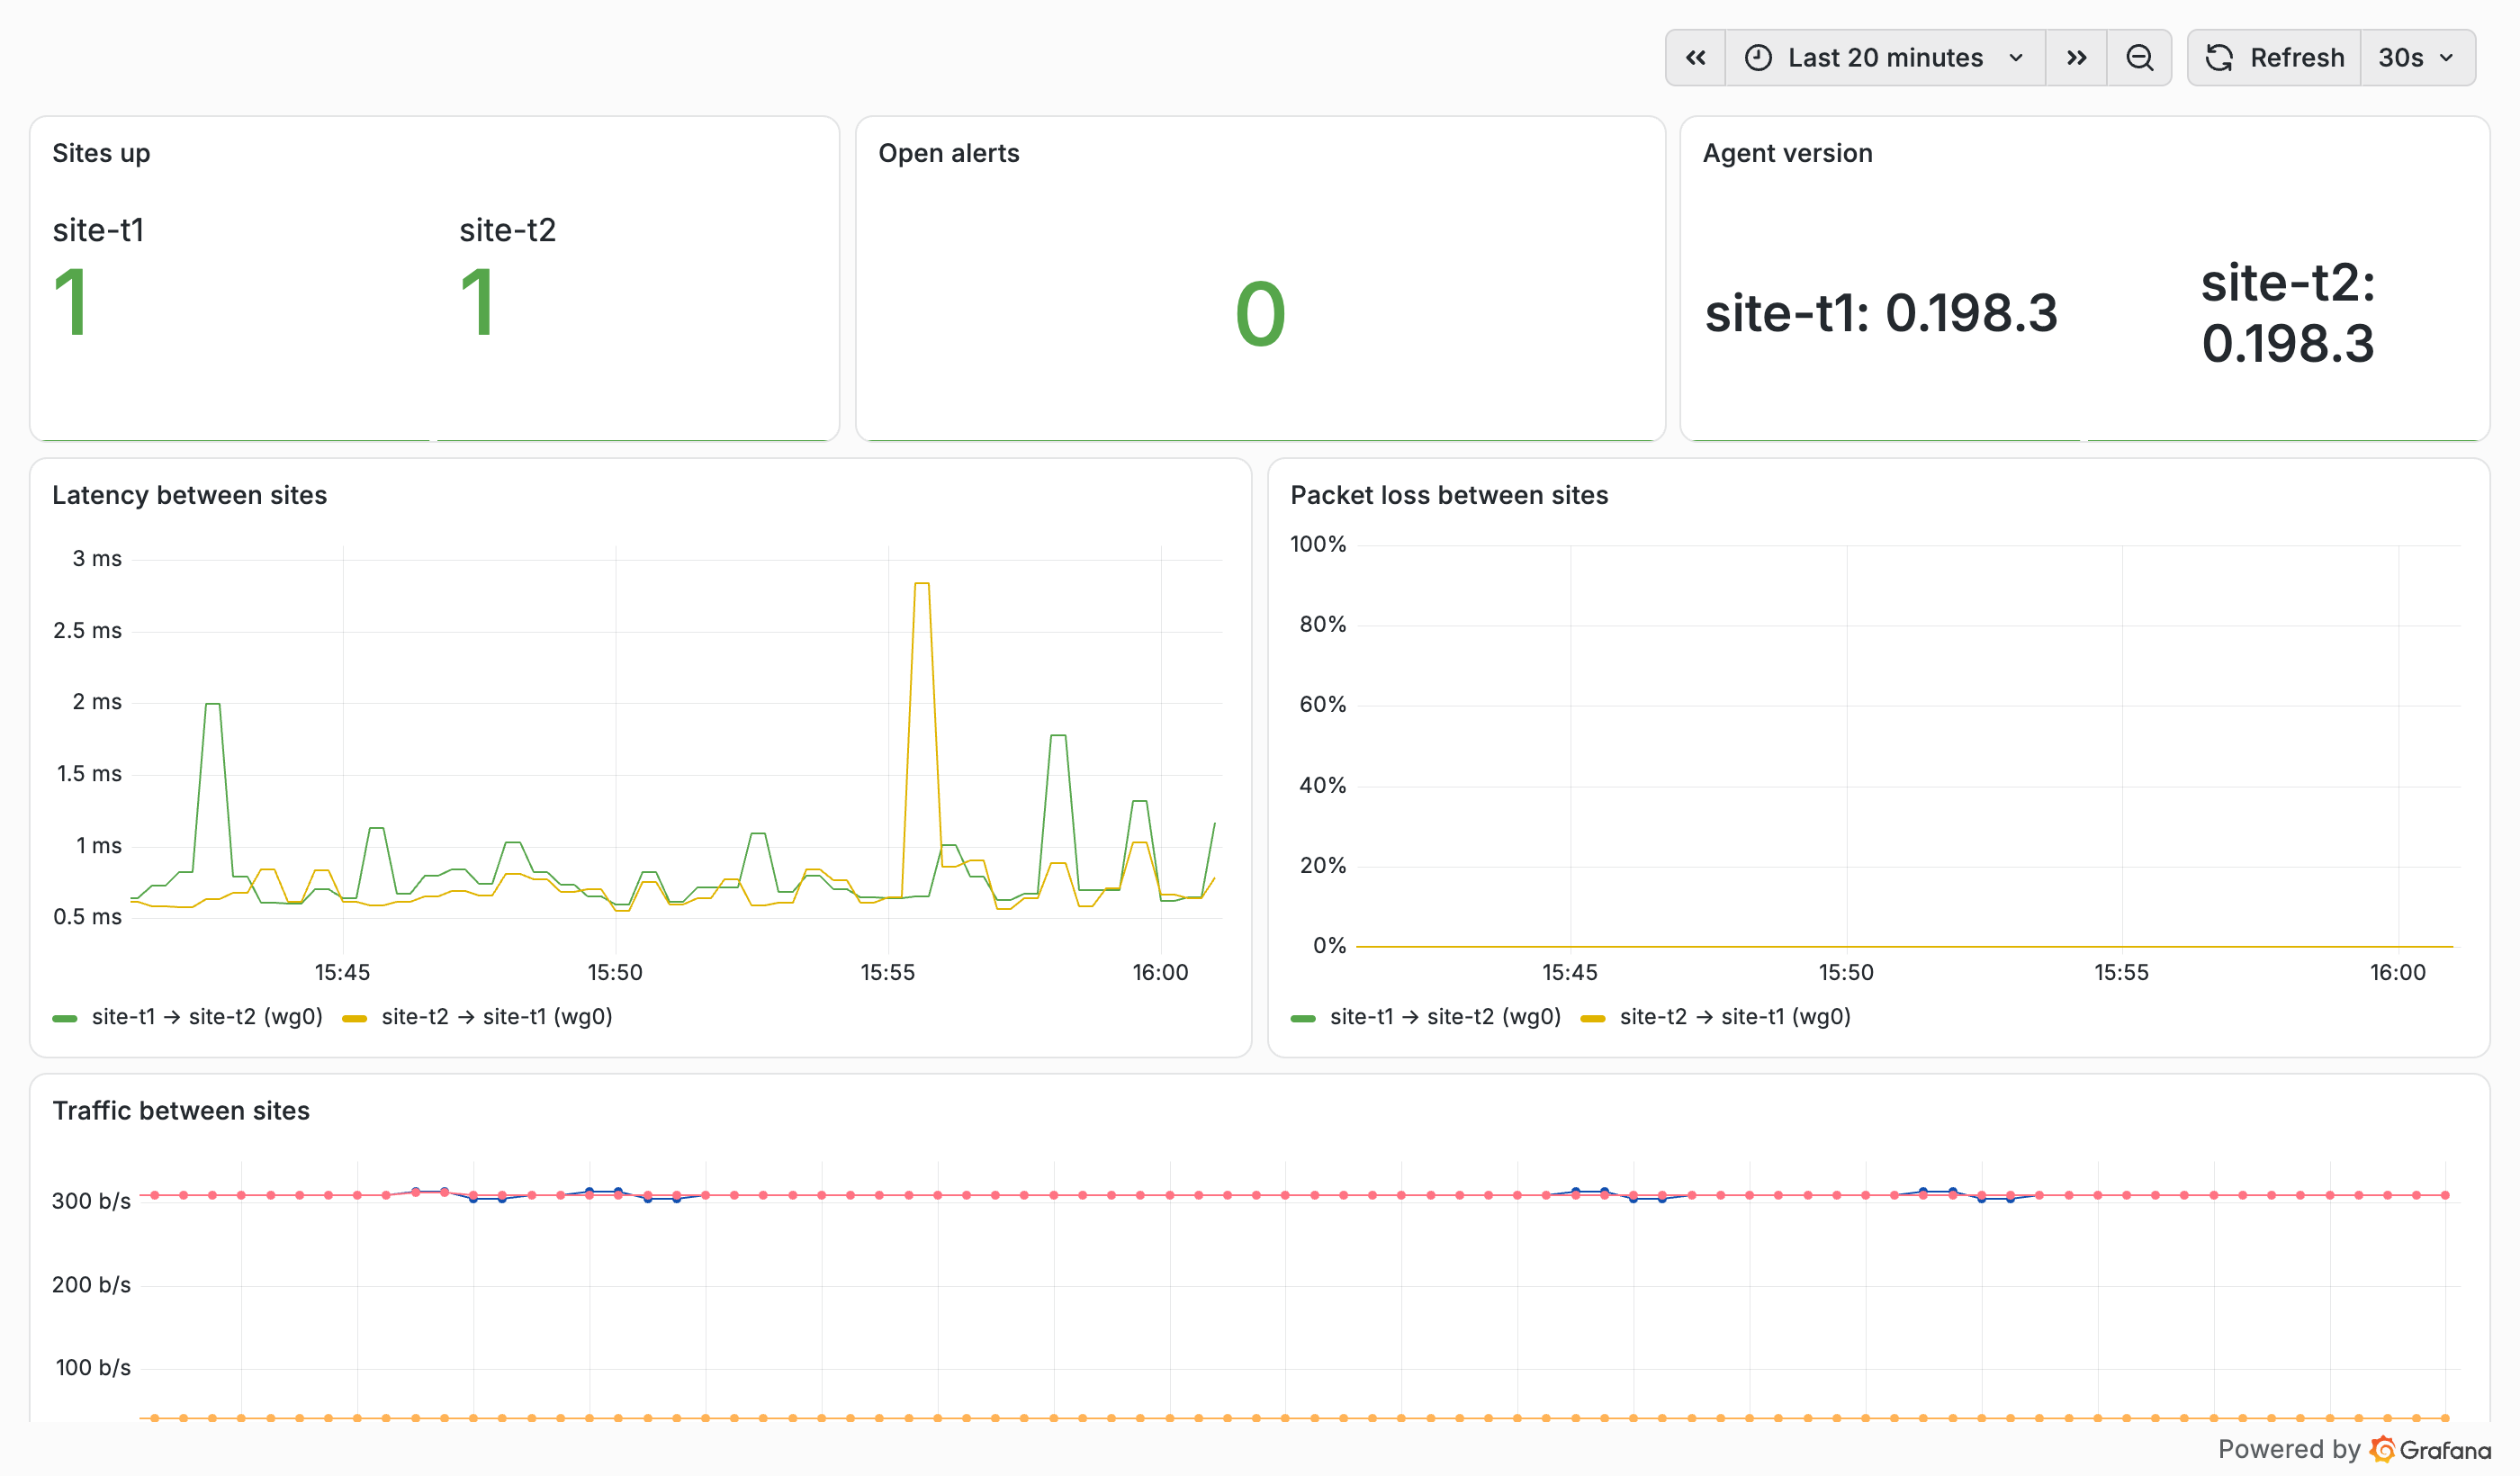
What you get
- Sites: whether each site is up, how long since it last reported, and the agent version it runs.
- Links between sites: whether each tunnel is up, with its latency, loss and jitter, as measured by the site.
- Traffic from each site to each other site, in total and by class.
- Alerts: every open alert, and a count by severity.
- Policy: the mode, and the flows it refused in the last 24 hours, by group.
They are the same numbers the console shows, read the same way.
Step 1: set an export secret
In the console, open Settings and set export_secret to a long random string, at least 24 characters. The row then shows the exact address for your scraper, including your organisation's id.
The secret is a key that only reads. It can't sign in, can't change anything and can't open the console. It does open all of Weft's exports: these metrics, the connection log for your SIEM, and each device's office and remote experience figures, which name people. So give it only to tools, and people, you would trust with those. It is masked on the Settings page like every other secret, and clearing the setting turns the exports off.
Step 2: add a scrape job
In Prometheus, add a job like this one, with your organisation's id and the secret in a file only Prometheus can read:
scrape_configs:
  - job_name: weft
    scheme: https
    metrics_path: /api/export/metrics
    params: { org: ["your-organisation-id"] }
    static_configs: [{ targets: ["app.weftnetworks.com"] }]
    authorization: { credentials_file: /etc/prometheus/weft-secret }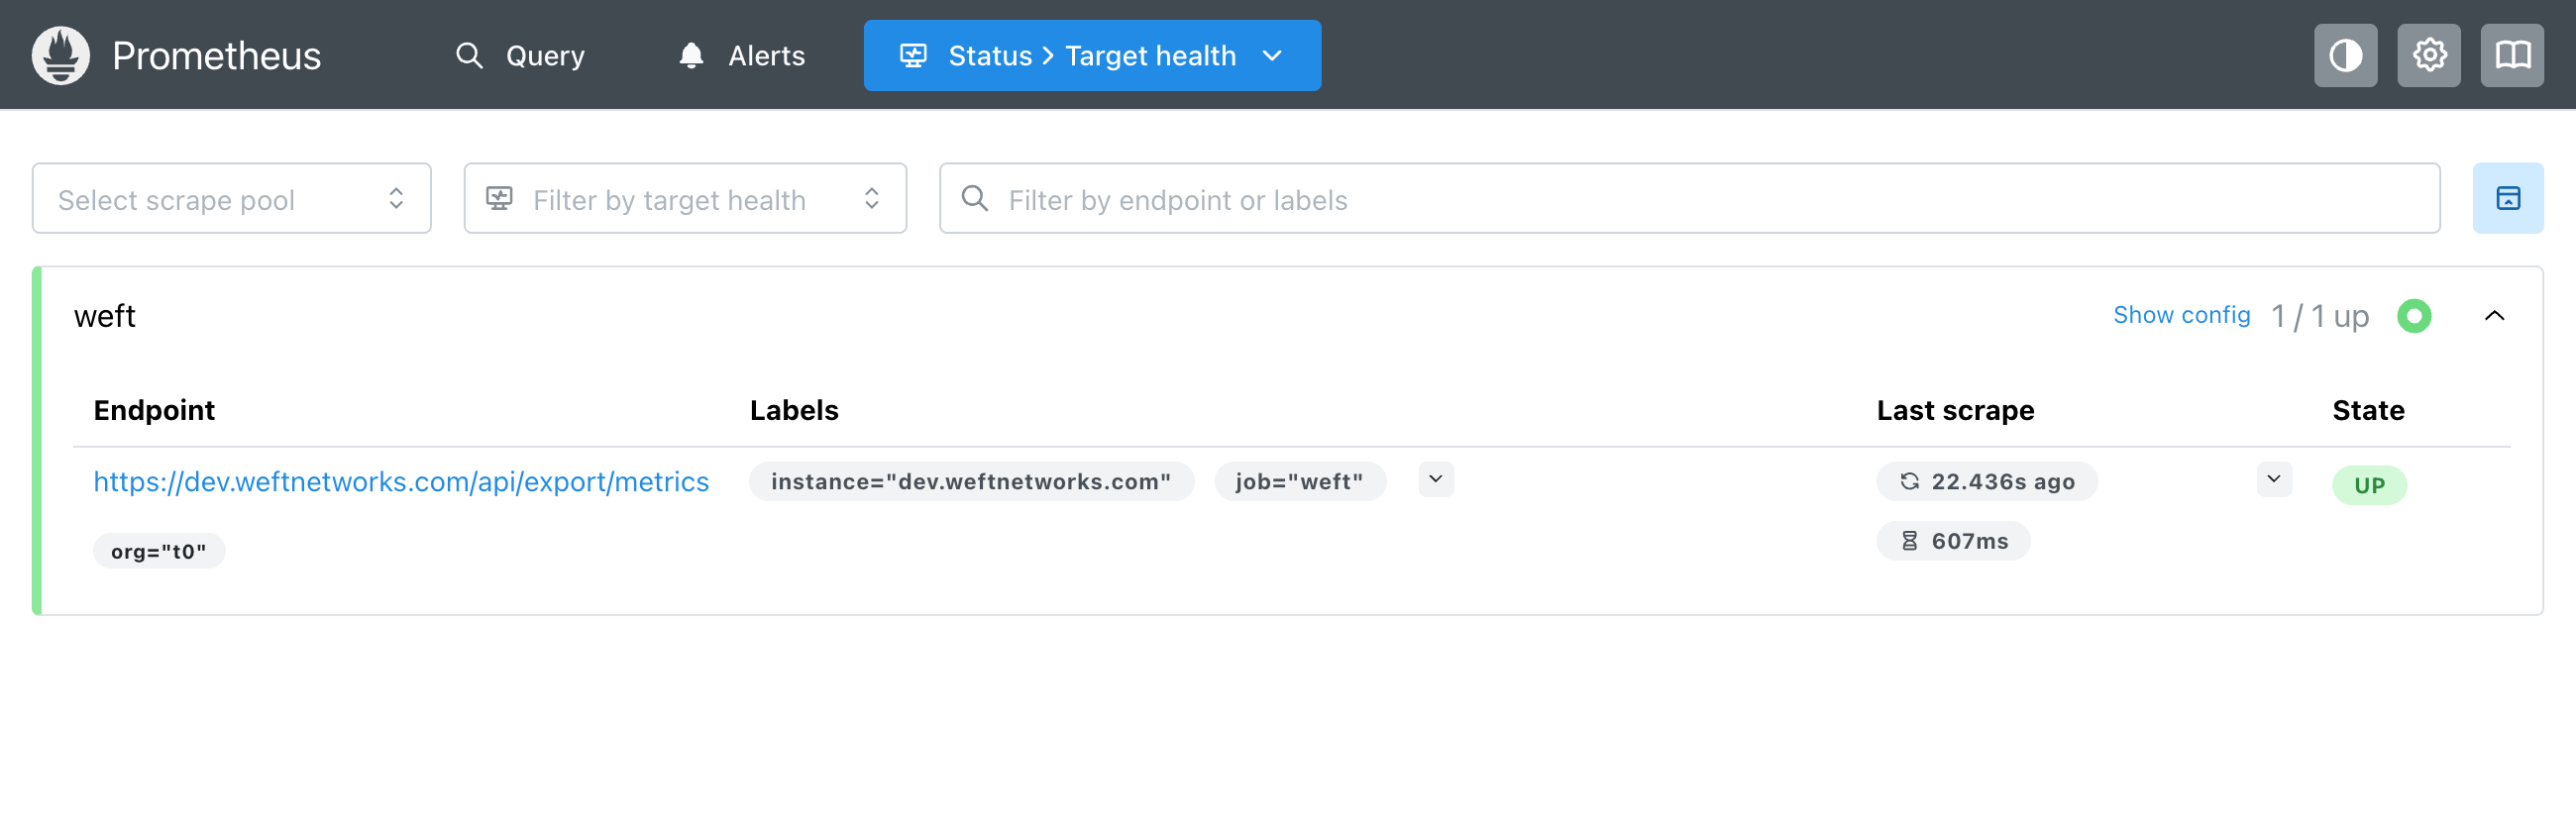
Step 3: build the dashboard
Every family starts with weft_. The panels above use these queries:
weft_site_up: 1 for each site that is up.weft_path_rtt_msandweft_path_loss_pct, labelled by site and peer.weft_traffic_bps{class=""}for total traffic between sites.sum(weft_alerts_open)for the open alert count.
Every value is a reading of "now". The history is your Prometheus's job, which is the point of exporting.
History in the console, too
If you would rather not run Prometheus, each site's page in the console keeps a month of throughput, latency and loss to every other site, by the hour. Over a week or a month, loss is drawn as the worst minute in each hour, so a 30-second outage doesn't vanish into an average.
Alerts where you work
For alerts, the alert_webhook setting posts each new alert, and each one clearing, to a Slack or Teams channel, or to an ntfy topic for a notification on your phone. The words are the same as in the alert email.
To look round the console first without signing up, see the demo console.